![]()
![]()

We need your help! 🔥
Please consider disabling your ad-blocker to support this website! 🔑
We are a free, community-supported website! 🥰
We only display small unobtrusive ads which help us stay online! 💯
Thank you in advance! ❤️
We are a free, community-supported website! 🥰
We only display small unobtrusive ads which help us stay online! 💯
Thank you in advance! ❤️
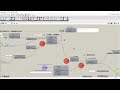
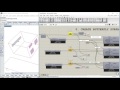
Plot Residuals
Load residual values for a case.
-
Inputs
| Name | ID | Description | Type |
|---|---|---|---|
| solution | _solution | A Butterfly recipe. | Goo |
| rect | _rect | A rectangle for boundary chart. | Goo |
| fields | _fields_ | Residual fields. If empty solution's fields will be used. | Goo |
| target_res | _target_res_ | Residential number that will be added to the graph as a black line. | Goo |
| . | . | Script variable plotResiduals | Goo |
| time_range | time_range_ | Time range for loading residuals as a domain. | Goo |
| method | method_ | Method of ploting the values (0..1). 0: Curves, 1: Colored mesh If you're updating the values frequently use method 1 which is the quicker method. | Goo |
| load | _load | Set to True to plot the chart. | Goo |
Outputs
| Name | ID | Description | Type |
|---|---|---|---|
| out | report | Reports, erros, warnings, etc. | String |
| time_range | time_range | Total time range. | Goo |
| curves | curves | Lines as curves. | Goo |
| . | . | Lines as meshes. | Goo |
| residual_line | residual_line | Residual line. | Goo |
| colors | colors | List of colors for meshes to color text, etc. | Goo |

Site design © Robin Rodricks.
Site co-created by Andrew Heumann.
Butterfly and associated data © 2025 Mostapha Sadeghipour Roudsari.
Rhinoceros and Grasshopper are registered trademarks of Robert McNeel & Associates.
Hosted by GitHub