![]()
![]()

We need your help! 🔥
Please consider disabling your ad-blocker to support this website! 🔑
We are a free, community-supported website! 🥰
We only display small unobtrusive ads which help us stay online! 💯
Thank you in advance! ❤️
We are a free, community-supported website! 🥰
We only display small unobtrusive ads which help us stay online! 💯
Thank you in advance! ❤️
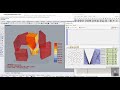
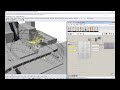
View Analysis
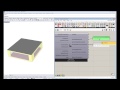
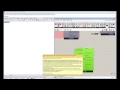
Use this component to evaluate the visibility of input _geometry from a set of key viewing points.
For example, this component can be used to evaluate the visibility of an 3D architectural feature from a set of key viewing points along a nearby street or park where people congregate.
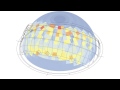
Another example would be evaluating the visibility of park vegetation geometry from a set of key sun position points from the sunPath component.
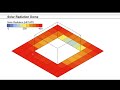
Yet another example would be evaluating the "visibility" of an outdoor overhead radiative heater from a set of key "viewing" points located over a human body standing beneath it.
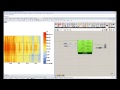
This component outputs a percentage of viewpoints seen by the input _geometry. In the three examples here, this would be the percentage of the 3D architectural feature seen from the street, the percentage of sunlit hours received by the vegetation, or the percentage of the human body warmed by the heater.
This component will evaluate view from the test points objectively in all directions.
Inputs
| Name | ID | Description | Type |
|---|---|---|---|
| Geometry | _geometry | Geometry for which visibility analysis will be conducted. Geometry must be either a Brep, a Mesh, or a list of Breps or Meshes. | Goo |
| Context | context_ | Context geometry that could block the view from the _viewTypeOrPoints to the test _geometry. Conext geometry must be either a Brep, a Mesh, or a list of Breps or Meshes. | Goo |
| Grid Size | _gridSize_ | A number in Rhino model units that represents the average size of a grid cell for visibility analysis on the test _geometry. This value should be smaller than the smallest dimension of the test _geometry for meaningful results. Note that, the smaller the grid size, the higher the resolution of the analysis and the longer the calculation will take. | Goo |
| Dis From Base | _disFromBase | A number in Rhino model units that represents the offset distance of the test point grid from the input test _geometry. Usually, the test point grid is offset by a small amount from the test _geometry in order to ensure that visibility analysis is done for the correct side of the test _geometry. If the resulting mesh of this component is offset to the wrong side of test _geometry, you should use the 'Flip' Rhino command on the test _geometry before inputting it to this component. | Goo |
| Orientation Study P | orientationStudyP_ | Optional output from the 'Orientation Study Parameter' component. You can use an Orientation Study input here to answer questions like 'What orientation of my building will give me the highest or lowest visibility from the street?' An Orientation Study will automatically rotate your input _geometry around several times and record the visibility results each time in order to output a list of values for averageView and a grafted data stream for viewStudyResult. | Goo |
| View Type Or Points | _viewTypeOrPoints | An integer representing the type of view analysis that you would like to conduct or a list of points to which you would like to test the view. For integer options, choose from the following options: 0 - Horizontal Radial - The percentage of the 360 horizontal view band visible from each test point. Use this to study horizontal views from interior spaces to the outdoors. 1 - Horizontal 60 Degree Cone of Vision - The percentage of the 360 horizontal view band bounded on top and bottom by a 30 degree offset from the horizontal (derived from the human cone of vision). Use this to study views from interior spaces to the outdoors. Note that this will discount the _geometry from the calculation and only look at _context that blocks the scene. 2 - Spherical - The percentage of the sphere surrounding each of the test points that is not blocked by context geometry. Note that this will discount the _geometry from the calculation and only look at _context that blocks the scene. 3 - Sky Exposure - The percentage of the sky that is visible from the points of the input _geometry (as opposed to Sky View, which is the amount of sky seen by a surface). This is equivalent to a solid angle or even-spaced ray-tracing calculation from the point. It is useful for evaluating one's general visual connection to the sky at a given set of points. 4 - Sky View - The percentage of the sky that is visible from the surface _geometry (as opposed to Sky Exposure, which is the amount of sky seen by the points). While Sky Exposure treats each patch of the sky with relatively equal weight, sky view weights these patches by their area projected into the plane of the surface being evaluated. In other words, sky view for a horizontal surface would give more importance to the sky patches that are overhead vs near the horizon. Sky view is an important factor in for modelling urban heat island since the inability of warm urban surfaces to radiate heat to a cool night sky is one of the largest contributors of the heat island effect. | Goo |
| View Pts Weights | viewPtsWeights_ | A list of numbers that align with the test points to assign weights of importance to the several _viewTypeOrPoints that have been connected. Weighted values should be between 0 and 1 and should be closer to 1 if a certain point is more important. The default value for all points is 0, which means they all have an equal importance. This input could be useful in cases such as the radiative heater example where points on the human body with exposed skin could be weighted at a higher value. | Goo |
| Geometry Blocks View | geometryBlocksView_ | Set to 'True' to have the component count the input _geometry as opaque and set to 'False' to discount the _geometry from the calculation and only look at context_ that blocks the view. The default is set to 'False' for all types of view studies except for (3 - Sky Exposure) and (4 - Sky View), where the default is set to 'True.' | Goo |
| ----- | ----- | ... | Goo |
| _____________________ | ... | Goo | |
| Legend Par | legendPar_ | Optional legend parameters from the Ladybug Legend Parameters component. | Goo |
| Parallel | parallel_ | Set to 'True' to run the visibility analysis using multiple CPUs. This can dramatically decrease calculation time but can interfere with other intense computational processes that might be running on your machine. | Goo |
| Run It | _runIt | Set to 'True' to run the component and perform visibility analysis of the input _geometry. | Goo |
| Bake It | bakeIt_ | An integer that tells the component if/how to bake the bojects in the Rhino scene. The default is set to 0. Choose from the following options: 0 (or False) - No geometry will be baked into the Rhino scene (this is the default). 1 (or True) - The geometry will be baked into the Rhino scene as a colored hatch and Rhino text objects, which facilitates easy export to PDF or vector-editing programs. 2 - The geometry will be baked into the Rhino scene as colored meshes, which is useful for recording the results of paramteric runs as light Rhino geometry. | Goo |
Outputs
| Name | ID | Description | Type |
|---|---|---|---|
| Out | readMe! | ... | String |
| Context Mesh | contextMesh | An uncolored mesh representing the context_ geometry that was input to this component. Connect this output to a "Mesh" grasshopper component to preview this output seperately from the others of this component. Note that this mesh is generated before the analysis is run, allowing you to be sure that the right geometry will be run through the analysis before running this component. | Goo |
| Analysis Mesh | analysisMesh | An uncolored mesh representing the test _geometry that will be analyzed. Connect this output to a "Mesh" grasshopper component to preview this output seperately from the others of this component. Note that this mesh is generated before the analysis is run, allowing you to be sure that the right geometry will be run through the analysis before running this component. | Goo |
| Test Pts | testPts | The grid of test points on the test _geometry that will be used to perform the visibility analysis. Note that these points are generated before the analysis is run, allowing you to preview the resolution of the result before you run the component. | Goo |
| Test Vec | testVec | Vectors for each of the test points on the test _geometry, which indicate the direction for which visibility analysis is performed. Hook this and the test points up to a Grasshopper "Vector Display" component to see how analysis is performed on the test _geometry. | Goo |
| View Vec | viewVec | Script variable viewAnalysis | Goo |
| _____________________ | ... | Goo | |
| View Study Result | viewStudyResult | The percentage of _viewTypeOrPoints visible from each of the test points of the input test _geometry. | Goo |
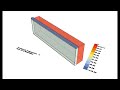
| View Study Mesh | viewStudyMesh | A colored mesh of the test _geometry representing the percentage of _viewTypeOrPoints visible by each part of the input _geometry. | Goo |
| View Study Legend | viewStudyLegend | A legend for the visibility analysis showing the percentage of visible points that correspond to the colors of the viewStudyMesh. Connect this output to a grasshopper "Geo" component in order to preview the legend separately in the Rhino scene. | Goo |
| Legend Base Pt | legendBasePt | The legend base point, which can be used to move the legend in relation to the view study mesh with the grasshopper "move" component. | Goo |
| Average View | averageView | The average percentage of the _viewTypeOrPoints seen by all of the test _geometry. | Goo |
| Pt Is Visible | ptIsVisible | A grafted data stream for each _geometry test point with a "1" for each _viewPoint that is visible by the test point and a "0" for each _viewPoint that is blocked. | Goo |


Site design © Robin Rodricks.
Site co-created by Andrew Heumann.
Ladybug and associated data © 2025 Ladybug Tools.
Rhinoceros and Grasshopper are registered trademarks of Robert McNeel & Associates.
Hosted by GitHub