![]()
![]()

We need your help! 🔥
Please consider disabling your ad-blocker to support this website! 🔑
We are a free, community-supported website! 🥰
We only display small unobtrusive ads which help us stay online! 💯
Thank you in advance! ❤️
We are a free, community-supported website! 🥰
We only display small unobtrusive ads which help us stay online! 💯
Thank you in advance! ❤️
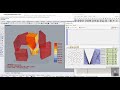
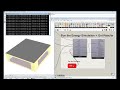
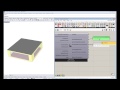
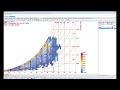
Wind Rose
Use this component to make a windRose in the Rhino scene. In this wind rose diagram, each wedge represents the percentage of time the wind came from that direction during the analysis period you choose. You will note that each wedge is also colored. These colors relate directly with the legend displayed on the right. The colors in a wedge conveys the relative percentage of time the wind coming from that direction was within that speed range.
Inputs
| Name | ID | Description | Type |
|---|---|---|---|
| North | _north_ | Input a vector to be used as a true North direction for the wind rose or a number between 0 and 360 that represents the degrees off from the y-axis to make North. The default North direction is set to the Y-axis (0 degrees). | Goo |
| Hourly Wind Direction | _hourlyWindDirection | The list of hourly wind direction data from the Import epw component. | Goo |
| Hourly Wind Speed | _hourlyWindSpeed | The list of hourly wind speed data from the Import epw component. | Goo |
| Annual Hourly Data | annualHourlyData_ | An optional list of hourly data from the Import epw component, which will be overlaid on wind rose (e.g. dryBulbTemperature) | Goo |
| Analysis Period | _analysisPeriod_ | An optional analysis period from the Analysis Period component. | Goo |
| Conditional Statement | conditionalStatement_ | This input allows users to remove data that does not fit specific conditions or criteria from the wind rose. To use this input correctly, hourly data, such as temperature or humidity, must be plugged into the annualHourlyData_ input. The conditional statement input here should be a valid condition statement in Python, such as "a>25" or "b<80" (without quotation marks).
The current version of this component accepts "and" and "or" operators. To visualize the hourly data, only lowercase English letters should be used as variables, and each letter alphabetically corresponds to each of the lists (in their respective order): "a" always represents the 1st list, "b" always represents the 2nd list, etc.
For the WindBoundaryProfile component, the variable "a" always represents windSpeed. For example, if you have hourly dry bulb temperature connected as the second list, and relative humidity connected as the third list (both to the annualHourlyData_ input), and you want to plot the data for the time period when temperature is between 18C and 23C, and humidity is less than 80%, the conditional statement should be written as “18| Goo | |
| Num Of Directions | _numOfDirections_ | A number of cardinal directions with which to divide up the data in wind rose. Values must be greater than 4 since you can have no fewer than 4 cardinal directions. | Goo |
| Center Point | _centerPoint_ | Input a point here to change the location of the wind rose in the Rhino scene. The default is set to the Rhino model origin (0,0,0). | Goo |
| Max Frequency | maxFrequency_ | An optional number between 1 and 100 that represents the maximum percentage of hours that the outer-most ring of the wind rose represents. By default, this value is set by the wind direction with the largest number of hours (the highest frequency) but you may want to change this if you have several wind roses that you want to compare to each other. For example, if you have wind roses for different months or seasons, which each have different maximum frequencies. | Goo |
| Show Frequency | showFrequency_ | Connect boolean and set it to True to display frequency of wind coming from each direction. By default, these values will be displayed in gray color. | Goo |
| Show Average Velocity | showAverageVelocity_ | Connect boolean and set it to True to display average wind velocity in m/s for wind coming from each direction. If a conditional statement is connected to the conditionalStatement_ input, a beaufort number is plotted(in square brackets) along with the average velocities. This number indicates the effect caused by wind of average velocity coming from that partcular direction. By default, these values will be displayed in black color. | Goo |
| Scale | _scale_ | Input a number here to change the scale of the wind rose. The default is set to 1. | Goo |
| Legend Par | legendPar_ | Optional legend parameters from the Ladybug Legend Parameters component. | Goo |
| Bake It | bakeIt_ | An integer that tells the component if/how to bake the bojects in the Rhino scene. The default is set to 0. Choose from the following options: 0 (or False) - No geometry will be baked into the Rhino scene (this is the default). 1 (or True) - The geometry will be baked into the Rhino scene as a colored hatch and Rhino text objects, which facilitates easy export to PDF or vector-editing programs. 2 - The geometry will be baked into the Rhino scene as colored meshes, which is useful for recording the results of paramteric runs as light Rhino geometry. | Goo |
| Run It | _runIt | Set this value to "True" to run the component and generate a wind rose in the Rhino scene. | Goo |
Outputs
| Name | ID | Description | Type |
|---|---|---|---|
| Out | readMe! | ... | String |
| Calm Rose Mesh | calmRoseMesh | A mesh in the center of the wind rose representing the relative number of hours where the wind speed is around 0 m/s. | Goo |
| Wind Rose Mesh | windRoseMesh | A mesh representing the wind speed from different directions for all hours analyzed. | Goo |
| Wind Rose Crvs | windRoseCrvs | A set of guide curves that mark the number of hours corresponding to the windRoseMesh. | Goo |
| Wind Rose Cen Pts | windRoseCenPts | The center point(s) of wind rose(s). Use this to move the wind roses in relation to one another using the grasshopper "move" component. | Goo |
| Legend | legend | A legend of the wind rose. Connect this output to a grasshopper "Geo" component in order to preview the legend separately in the Rhino scene. | Goo |
| Legend Base Pts | legendBasePts | The legend base point(s), which can be used to move the legend in relation to the rose with the grasshopper "move" component. | Goo |
| Title | title | The title for the wind rose. Connect this output to a grasshopper "Geo" component in order to preview the legend separately in the Rhino scene. | Goo |
| Average Velocity Mesh | averageVelocityMesh | Mesh output for average wind velocities displayed on WindRose. This will only output meshes if boolean value of True is provided to showAverageVelocity_. By default, these meshes are displayed in black color. | Goo |
| Frequency Mesh | frequencyMesh | Mesh output for frequencies displayed on WindRose. This will only output meshes if boolean value of True is provided to showFrequency_. By default, these meshes are displayed in gray color. | Goo |
| ------------------ | ------------------ | Script variable windRose | Goo |
| Wind Speeds | windSpeeds | Wind speed data for the wind rose displayed in the Rhino scene. | Goo |
| Wind Directions | windDirections | Wind direction data for the wind rose displayed in the Rhino scene. | Goo |
| Average Velocities | averageVelocities | A list containing average wind velocity for all wind rose directions. | Goo |
| Frequencies | frequencies | A list containing frequency of time the wind is coming from a particular direction for all wind rose directions. | Goo |


Site design © Robin Rodricks.
Site co-created by Andrew Heumann.
Ladybug and associated data © 2025 Ladybug Tools.
Rhinoceros and Grasshopper are registered trademarks of Robert McNeel & Associates.
Hosted by GitHub