![]()
![]()

We need your help! 🔥
Please consider disabling your ad-blocker to support this website! 🔑
We are a free, community-supported website! 🥰
We only display small unobtrusive ads which help us stay online! 💯
Thank you in advance! ❤️
We are a free, community-supported website! 🥰
We only display small unobtrusive ads which help us stay online! 💯
Thank you in advance! ❤️
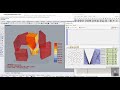
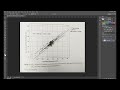
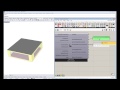
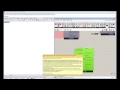
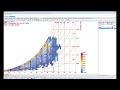
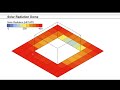
Line Chart
Use this component to make a line chart in the Rhino scene of any data with a ladybug header on it.
Inputs
| Name | ID | Description | Type |
|---|---|---|---|
| Input Data | _inputData | A list of input data to plot. This should usually be data out of the "Ladybug_Average Data" component or monthly data from an energy simulation but can also be hourly or daily data from the "Ladybug_Import EPW." However, it is recommended that you use the "Ladybug_3D Chart" component for daily or hourly data as this is usually a bit clearer. | Goo |
| Chart Type | chartType_ | An integer that sets the type of chart that will be drawn. Choose from the following options: 0 = Normal - Data will be plotted as polylines right next to each other. 1 = Stacked - Data will be plotted as lines stacked on top of one another. 2 = Stacked Area - Data will be plotted as filled areas stacked on top of one another. | Goo |
| Alt Title | altTitle_ | An optional text string to replace the default title of the chart of the chart. The default is set to pick out the location of the data connected to 'inputData.' | Goo |
| Alt YAxis Title | altYAxisTitle_ | An optional text string to replace the default Y-Axis label of the chart. This can also be a list of 2 y-axis titles if there are two different types of data connected to _inputData. The default is set to pick out the names of the first (and possibly the second) list connected to the 'inputData.' | Goo |
| Base Point | _basePoint_ | An optional point with which to locate the 3D chart in the Rhino Model. The default is set to the Rhino origin at (0,0,0). | Goo |
| X Scale | _xScale_ | The scale of the X axis of the graph. The default is set to 1 and this will plot the X axis with a length of 120 Rhino model units (for 12 months of the year). | Goo |
| Y Scale | _yScale_ | The scale of the Y axis of the graph. The default is set to 1 and this will plot the Y axis with a length of 50 Rhino model units. | Goo |
| Legend Par | legendPar_ | Optional legend parameters from the Ladybug Legend Parameters component. | Goo |
| Bake It | bakeIt_ | An integer that tells the component if/how to bake the bojects in the Rhino scene. The default is set to 0. Choose from the following options: 0 (or False) - No geometry will be baked into the Rhino scene (this is the default). 1 (or True) - The geometry will be baked into the Rhino scene as a colored hatch and Rhino text objects, which facilitates easy export to PDF or vector-editing programs. 2 - The geometry will be baked into the Rhino scene as colored meshes, which is useful for recording the results of paramteric runs as light Rhino geometry. | Goo |
Outputs
| Name | ID | Description | Type |
|---|---|---|---|
| Out | readMe! | ... | String |
| Data Mesh | dataMesh | A list of meshes that represent the different input data. | Goo |
| Data Curves | dataCurves | A list of curves that represent the different input data. | Goo |
| Data Crv Colors | dataCrvColors | A list of colors that correspond to the dataCurves above. Hook this up to the 'swatch' input of the native Grasshopper 'Preview' component and the curves above up to the 'geometry input to preview the curves with their repective color. | Goo |
| Graph Axes | graphAxes | A list of curves representing the axes of the chart. | Goo |
| Graph Labels | graphLabels | A list of text meshes representing the time periods corresponding to the input data | Goo |
| Title | title | A title for the chart. By default, this is just the location of the data but you can input a custom title with the altTitle_ input. | Goo |
| Title Base Pt | titleBasePt | The title base point, which can be used to move the title in relation to the chart with the grasshopper "move" component. | Goo |
| Legend | legend | A legend of the chart that tells what each connected data stram's color is. Connect this output to a grasshopper "Geo" component in order to preview the legend in the Rhino scene. | Goo |
| Legend Base Pt | legendBasePt | The legend base point, which can be used to move the legend in relation to the chart with the grasshopper "move" component. | Goo |


Site design © Robin Rodricks.
Site co-created by Andrew Heumann.
Ladybug and associated data © 2025 Ladybug Tools.
Rhinoceros and Grasshopper are registered trademarks of Robert McNeel & Associates.
Hosted by GitHub