![]()
![]()

We need your help! 🔥
Please consider disabling your ad-blocker to support this website! 🔑
We are a free, community-supported website! 🥰
We only display small unobtrusive ads which help us stay online! 💯
Thank you in advance! ❤️
We are a free, community-supported website! 🥰
We only display small unobtrusive ads which help us stay online! 💯
Thank you in advance! ❤️
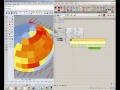
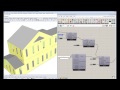
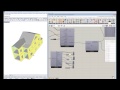
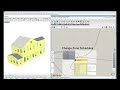
Color Surfaces by EP Result
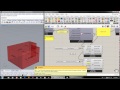
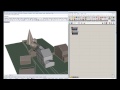
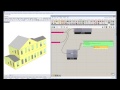
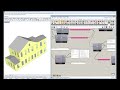
Use this component to color zone surfaces based on EnergyPlus data out of the "Honeybee_Read EP Surface Result" component.
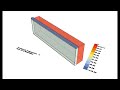
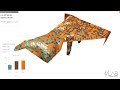
By default, zone surfaces will be colored based on total energy per unit surface area in the case of energy input data or colored based on average value of each surface in the case of temperature or data that is already normalized.
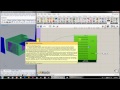
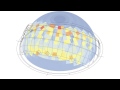
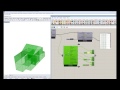
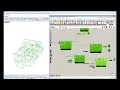
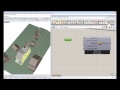
If total annual simulation data has been connected, the analysisPeriod_ input can be used to select out a specific period fo the year for coloration.
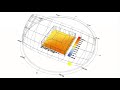
In order to color surfaces by individual hours/months, connecting interger values to the "stepOfSimulation_" will allow you to scroll though each step of the input data.
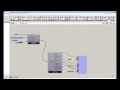
Inputs
| Name | ID | Description | Type |
|---|---|---|---|
| Srf Data | _srfData | A list surface data out of the 'Honeybee_Read EP Surface Result' component. | Goo |
| HBZones | _HBZones | The HBZones out of any of the HB components that generate or alter zones. Note that these should ideally be the zones that are fed into the Run Energy Simulation component as surfaces may not align otherwise. Zones read back into Grasshopper from the Import idf component will not align correctly with the EP Result data. | Goo |
| =============== | =============== | ... | Goo |
| Normalize By Srf Area | normalizeBySrfArea_ | Set boolean to 'True' in order to normalize results by the area of the surface and set to 'False' to color zones based on total values for each surface. The default is set to 'True' such that colored surface communicate energy intensity rather than total energy. Note that this input will be ignored if connected data is Temperature or values that are already normalized. | Goo |
| Analysis Period | analysisPeriod_ | Optional analysisPeriod_ to take a slice out of an annual data stream. Note that this will only work if the connected data is for a full year and the data is hourly. Otherwise, this input will be ignored. Also note that connecting a value to 'stepOfSimulation_' will override this input. | Goo |
| Step Of Simulation | stepOfSimulation_ | Optional interger for the hour of simulation to color the surfaces with. Connecting a value here will override the analysisPeriod_ input. | Goo |
| Legend Par | legendPar_ | Optional legend parameters from the Ladybug Legend Parameters component. | Goo |
| Run It | _runIt | Set boolean to 'True' to run the component and color the zone surfaces. | Goo |
Outputs
| Name | ID | Description | Type |
|---|---|---|---|
| Read Me! | readMe! | ... | String |
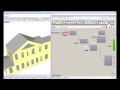
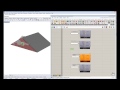
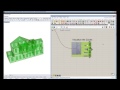
| Srf Colored Mesh | srfColoredMesh | A list of meshes for each surface, each of which is colored based on the input _srfData. | Goo |
| Zone Wire Frame | zoneWireFrame | A list of curves representing the outlines of the zones. This is particularly helpful if one wants to scroll through individual meshes but still see the outline of the building. | Goo |
| Legend | legend | A legend of the surface colors. Connect this output to a grasshopper 'Geo' component in order to preview the legend spearately in the Rhino scene. | Goo |
| Legend Base Pt | legendBasePt | The legend base point, which can be used to move the legend in relation to the building with the grasshopper 'move' component. | Goo |
| Analysis Title | analysisTitle | The title of the analysis stating what the surfaces are being colored with. | Goo |
| Srf Breps | srfBreps | A list of breps for each zone surface. Connecting this output and the following zoneColors to a Grasshopper 'Preview' component will thus allow you to see the surfaces colored transparently. | Goo |
| Srf Colors | srfColors | A list of colors that correspond to the colors of each zone surface. These colors include alpha values to make them slightly transparent. Connecting the previous output and this output to a Grasshopper 'Preview' component will thus allow you to see the surfaces colored transparently. | Goo |
| Srf Values | srfValues | The values of the input data that are being used to color the surfaces. | Goo |
| Relevant Srf Data | relevantSrfData | The input data used to color the zones. | Goo |


Site design © Robin Rodricks.
Site co-created by Andrew Heumann.
Honeybee and associated data © 2025 Ladybug Tools.
Rhinoceros and Grasshopper are registered trademarks of Robert McNeel & Associates.
Hosted by GitHub